Project: Your Home in the Cloud - Weather Monitoring with Azure
- Part 1: Requirements and Data Architecture (We are here)
- Part 2: Implementation
- Reference: GitHub Repo
Motivations
- Make use of a Raspberry Pi in a storage
- Get hands-on skill in using cloud platform
Choose to learn Azure because
- The most popular choices, together with AWS
- Recent rise in reputation
- Microsoft’s breadth might be better for freelancing opportunities
Requirements:
- Periodically read temperature/humidity from sensor(s) in the house.
This task can be scheduled on a Raspberry Pi. - Store temperature/humidity with details of timestamp and sensor_id (location).
- Display home data in a dashboard
Some foundations that could be helpful.
- General understanding of cloud computing services
- Overview of Azure services
- Internet-of-Things (IoT)
- Serverless computing – this project uses Azure Functions
- SQL database – this project uses Azure SQL Database
- Data dashboard – Grafana and Power BI are used here
- Basic Python if you want to understand underlying code
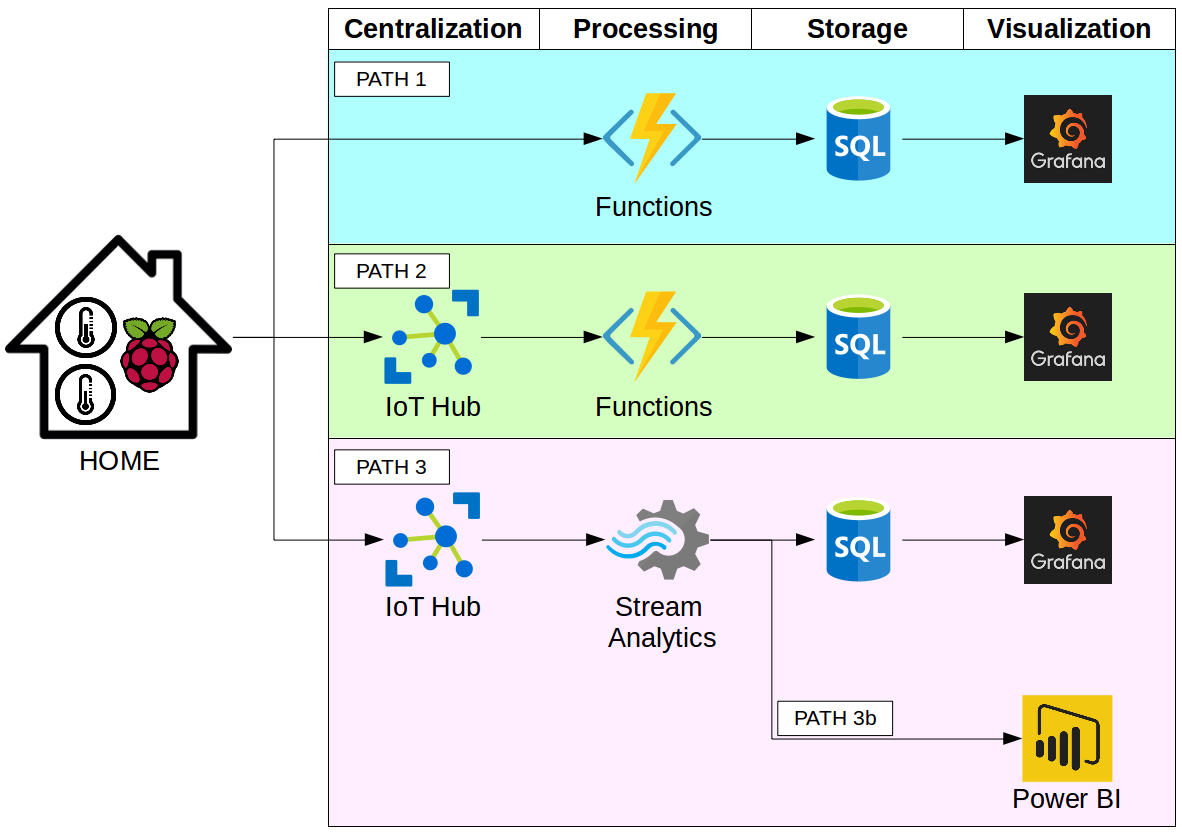
High-level architect
I propose 3 paths that can accomplish our requirements. Simply based on Azure services that I am interested in playing with. There certainly are many other ways.
All paths start at HOME where a Raspberry Pi collects sensors’ data and sends to Azure. This checks requirement (1).
Note that the HOME part can be simulated using a Raspberry Pi Azure IoT Online Simulator. No physical sensors and Raspberry Pi are needed. Check https://docs.microsoft.com/en-us/azure/iot-hub/iot-hub-raspberry-pi-web-simulator-get-started.
PATH 1:
Data from HOME directly triggers Azure Functions. This Functions processed the data into a desirable format. It then appends data to a predefined table in Azure SQL Database. Grafana can later read and display a dashboard of the data.
PATH 2:
Data from HOME is sent to Azure IoT Hub when it packages a data stream. This data stream then triggers Azure Functions to process and write formatted data to Azure SQL Database. Grafana can later read and display data from the database.
PATH 3:
Follow the same steps as in PATH 2 until Azure IoT Hub. Then the data stream goes to Azure Stream Analytics. It can write data to Azure SQL Database which is connected to Grafana. Or it can write data directly to Power BI showing a live dashboard (PATH 3b).
Let’s explore pros and cons of each path.
| PATH | PROS | CONS |
|---|---|---|
| 1 | Most simple for one HOME. |
It might not scale well. Since there is no unit for data centralization. It will be difficult if we have several HOMEs to manage and monitor. I have no idea what will happen if many HOMEs are calling the same Azure Functions. |
| 2 |
Still very simple. It takes marginal effort to set up Azure IoT Hub. The centralization step makes it possible to keep track and monitor data from several HOMEs. It also packages data from different sources to one stream. Creating a clean data flow to Azure Functions. |
You still need an Azure Functions. But that’s what I want to learn anyway. |
| 3 |
No coding for data processing needed. Azure Stream Analytics does all the jobs for you. It supports several types of data sources and storages, as an input and output. As mentioned, it can connect directly to Power BI to display live data. |
Azure Stream Analytics is not included in Microsoft’s free tier package. |
My choice.
I chose PATH 2 as my long-term implementation. So I will be going through the implementation steps in more detail in the next article. Anyhow, I would recommend trying all the 3 paths. And other solutions. It was a lot of fun learning these wonderful services.
End
That concludes the requirements and data architecture of our project.
We will go through the implementation steps in the next post – Part 2: Implementation.