Data science workflow

1. Data collection

Also from https://github.com/RudrakshTuwani/Football-Data-Analysis-and-Prediction
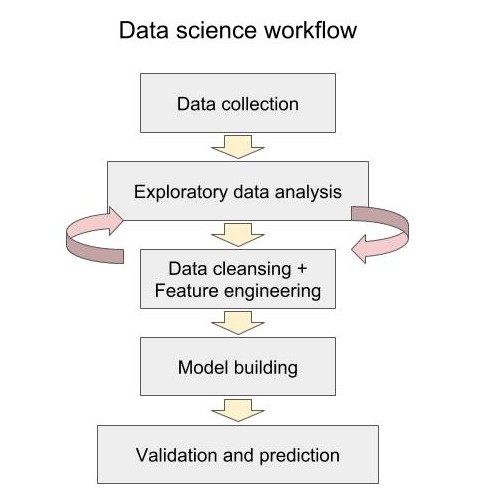
Typically the most difficult task

2. Data cleansing and feature engineering

In [43]:
# Import the necessary libraries.
import pandas as pd
import numpy as np
from datetime import datetime as dt

# Import local methods
from featureEng import *

# Not show warnings
import warnings
warnings.simplefilter(action='ignore')
In [44]:
# Import raw data
dataset_loc = '/home/chatdanai/Football-Data-Analysis-and-Prediction-master/Datasets/'
raw_data_1 = pd.read_csv(dataset_loc + '2000-01.csv')

# Parse data as time 
raw_data_1.Date = raw_data_1.Date.apply(parse_date)

raw_data_1.head()
Out[44]:
Div Date HomeTeam AwayTeam FTHG FTAG FTR HTHG HTAG HTR ... HC AC HF AF HO AO HY AY HR AR
0 E0 2000-08-19 Charlton Man City 4 0 H 2 0 H ... 6 6 13 12 8 6 1 2 0 0
1 E0 2000-08-19 Chelsea West Ham 4 2 H 1 0 H ... 7 7 19 14 2 3 1 2 0 0
2 E0 2000-08-19 Coventry Middlesbrough 1 3 A 1 1 D ... 8 4 15 21 1 3 5 3 1 0
3 E0 2000-08-19 Derby Southampton 2 2 D 1 2 A ... 5 8 11 13 0 2 1 1 0 0
4 E0 2000-08-19 Leeds Everton 2 0 H 2 0 H ... 6 4 21 20 6 1 1 3 0 0

5 rows × 28 columns

Play statistics e.g. HS (Home Team Shots), AS (Away Team Shots) will not be available before the match

Keep only features that can be used

In [45]:
#Gets all the statistics related to gameplay

columns_req = ['Date','HomeTeam','AwayTeam','FTHG','FTAG','FTR']

playing_stat = raw_data_1[columns_req]
In [46]:
playing_stat.head()
Out[46]:
Date HomeTeam AwayTeam FTHG FTAG FTR
0 2000-08-19 Charlton Man City 4 0 H
1 2000-08-19 Chelsea West Ham 4 2 H
2 2000-08-19 Coventry Middlesbrough 1 3 A
3 2000-08-19 Derby Southampton 2 2 D
4 2000-08-19 Leeds Everton 2 0 H

Feature engineering need a lot of thoughts

In [47]:
# Gets the goals scored agg arranged by teams and matchweek
playing_stat = get_gss(playing_stat)
In [48]:
playing_stat[(playing_stat[['HomeTeam','AwayTeam']]=='Liverpool').any(axis=1)].head()
Out[48]:
Date HomeTeam AwayTeam FTHG FTAG FTR HTGS ATGS HTGC ATGC
6 2000-08-19 Liverpool Bradford 1 0 H 0 0 0 0
10 2000-08-21 Arsenal Liverpool 2 0 H 0 1 1 0
26 2000-08-26 Southampton Liverpool 3 3 D 3 1 4 2
38 2000-09-06 Liverpool Aston Villa 3 1 H 4 2 5 4
43 2000-09-09 Liverpool Man City 3 2 H 7 7 6 9
In [49]:
# Gets teams' points before the match
playing_stat = get_agg_points(playing_stat)
In [50]:
playing_stat[(playing_stat[['HomeTeam','AwayTeam']]=='Liverpool').any(axis=1)].head()
Out[50]:
Date HomeTeam AwayTeam FTHG FTAG FTR HTGS ATGS HTGC ATGC HTP ATP
6 2000-08-19 Liverpool Bradford 1 0 H 0 0 0 0 0 0
10 2000-08-21 Arsenal Liverpool 2 0 H 0 1 1 0 0 3
26 2000-08-26 Southampton Liverpool 3 3 D 3 1 4 2 1 3
38 2000-09-06 Liverpool Aston Villa 3 1 H 4 2 5 4 4 2
43 2000-09-09 Liverpool Man City 3 2 H 7 7 6 9 7 6
In [51]:
#  Gets forms of the teams
playing_stat = add_form_df(playing_stat)
In [52]:
playing_stat[(playing_stat[['HomeTeam','AwayTeam']]=='Liverpool').any(axis=1)].tail()
Out[52]:
Date HomeTeam AwayTeam FTHG FTAG FTR HTGS ATGS HTGC ATGC ... HM1 AM1 HM2 AM2 HM3 AM3 HM4 AM4 HM5 AM5
344 2001-04-28 Coventry Liverpool 0 2 A 34 60 56 37 ... W W L W W W W L L D
354 2001-05-01 Bradford Liverpool 0 2 A 28 62 63 37 ... L W L W W W W W L L
361 2001-05-05 Liverpool Newcastle 3 0 H 65 41 37 50 ... W L W D W W W D W W
366 2001-05-08 Liverpool Chelsea 2 2 D 65 64 37 42 ... W W W L W L W W W W
370 2001-05-19 Charlton Liverpool 0 4 A 50 67 53 39 ... L D W W W W D W L W

5 rows × 22 columns

In [53]:
#  Gets matchweek
playing_stat = get_mw(playing_stat)
In [54]:
playing_stat[(playing_stat[['HomeTeam','AwayTeam']]=='Liverpool').any(axis=1)].head()
Out[54]:
Date HomeTeam AwayTeam FTHG FTAG FTR HTGS ATGS HTGC ATGC ... AM1 HM2 AM2 HM3 AM3 HM4 AM4 HM5 AM5 MW
6 2000-08-19 Liverpool Bradford 1 0 H 0 0 0 0 ... M M M M M M M M M 1
10 2000-08-21 Arsenal Liverpool 2 0 H 0 1 1 0 ... W M M M M M M M M 2
26 2000-08-26 Southampton Liverpool 3 3 D 3 1 4 2 ... L D W M M M M M M 3
38 2000-09-06 Liverpool Aston Villa 3 1 H 4 2 5 4 ... L L D W D M M M M 4
43 2000-09-09 Liverpool Man City 3 2 H 7 7 6 9 ... W D L L W W L M M 5

5 rows × 23 columns

In [55]:
#  Gets last season standing
Standings = pd.read_csv(dataset_loc + "EPLStandings.csv")
Standings.set_index(['Team'], inplace=True)
Standings = Standings.fillna(18)

playing_stat = get_last(playing_stat, Standings, 0)
In [56]:
playing_stat[(playing_stat[['HomeTeam','AwayTeam']]=='Liverpool').any(axis=1)].head()
Out[56]:
Date HomeTeam AwayTeam FTHG FTAG FTR HTGS ATGS HTGC ATGC ... AM2 HM3 AM3 HM4 AM4 HM5 AM5 MW HomeTeamLP AwayTeamLP
6 2000-08-19 Liverpool Bradford 1 0 H 0 0 0 0 ... M M M M M M M 1 4.0 17.0
10 2000-08-21 Arsenal Liverpool 2 0 H 0 1 1 0 ... M M M M M M M 2 2.0 4.0
26 2000-08-26 Southampton Liverpool 3 3 D 3 1 4 2 ... W M M M M M M 3 15.0 4.0
38 2000-09-06 Liverpool Aston Villa 3 1 H 4 2 5 4 ... D W D M M M M 4 4.0 6.0
43 2000-09-09 Liverpool Man City 3 2 H 7 7 6 9 ... L L W W L M M 5 4.0 18.0

5 rows × 25 columns

In [57]:
# Gets the form points.
playing_stat['HTFormPtsStr'] = playing_stat['HM1'] + playing_stat['HM2'] + playing_stat['HM3'] + playing_stat['HM4'] + playing_stat['HM5']
playing_stat['ATFormPtsStr'] = playing_stat['AM1'] + playing_stat['AM2'] + playing_stat['AM3'] + playing_stat['AM4'] + playing_stat['AM5']

playing_stat['HTFormPts'] = playing_stat['HTFormPtsStr'].apply(get_form_points)
playing_stat['ATFormPts'] = playing_stat['ATFormPtsStr'].apply(get_form_points)
In [58]:
playing_stat[(playing_stat[['HomeTeam','AwayTeam']]=='Liverpool').any(axis=1)].head()
Out[58]:
Date HomeTeam AwayTeam FTHG FTAG FTR HTGS ATGS HTGC ATGC ... AM4 HM5 AM5 MW HomeTeamLP AwayTeamLP HTFormPtsStr ATFormPtsStr HTFormPts ATFormPts
6 2000-08-19 Liverpool Bradford 1 0 H 0 0 0 0 ... M M M 1 4.0 17.0 MMMMM MMMMM 0 0
10 2000-08-21 Arsenal Liverpool 2 0 H 0 1 1 0 ... M M M 2 2.0 4.0 LMMMM WMMMM 0 3
26 2000-08-26 Southampton Liverpool 3 3 D 3 1 4 2 ... M M M 3 15.0 4.0 LDMMM LWMMM 1 3
38 2000-09-06 Liverpool Aston Villa 3 1 H 4 2 5 4 ... M M M 4 4.0 6.0 DLWMM LDDMM 4 2
43 2000-09-09 Liverpool Man City 3 2 H 7 7 6 9 ... L M M 5 4.0 18.0 WDLWM WLWLM 7 6

5 rows × 29 columns

In [59]:
# Get Goal Difference
playing_stat['HTGD'] = playing_stat['HTGS'] - playing_stat['HTGC']
playing_stat['ATGD'] = playing_stat['ATGS'] - playing_stat['ATGC']

# Diff in points
playing_stat['DiffPts'] = playing_stat['HTP'] - playing_stat['ATP']
playing_stat['DiffFormPts'] = playing_stat['HTFormPts'] - playing_stat['ATFormPts']

# Diff in last year positions
playing_stat['DiffLP'] = playing_stat['HomeTeamLP'] - playing_stat['AwayTeamLP']
In [60]:
playing_stat[(playing_stat[['HomeTeam','AwayTeam']]=='Liverpool').any(axis=1)].head()
Out[60]:
Date HomeTeam AwayTeam FTHG FTAG FTR HTGS ATGS HTGC ATGC ... AwayTeamLP HTFormPtsStr ATFormPtsStr HTFormPts ATFormPts HTGD ATGD DiffPts DiffFormPts DiffLP
6 2000-08-19 Liverpool Bradford 1 0 H 0 0 0 0 ... 17.0 MMMMM MMMMM 0 0 0 0 0 0 -13.0
10 2000-08-21 Arsenal Liverpool 2 0 H 0 1 1 0 ... 4.0 LMMMM WMMMM 0 3 -1 1 -3 -3 -2.0
26 2000-08-26 Southampton Liverpool 3 3 D 3 1 4 2 ... 4.0 LDMMM LWMMM 1 3 -1 -1 -2 -2 11.0
38 2000-09-06 Liverpool Aston Villa 3 1 H 4 2 5 4 ... 6.0 DLWMM LDDMM 4 2 -1 -2 2 2 -2.0
43 2000-09-09 Liverpool Man City 3 2 H 7 7 6 9 ... 18.0 WDLWM WLWLM 7 6 1 -2 1 1 -14.0

5 rows × 34 columns

In [61]:
# Scale DiffPts , DiffFormPts, HTGD, ATGD by Matchweek.
cols = ['HTGD','ATGD','DiffPts','DiffFormPts','HTP','ATP']
playing_stat.MW = playing_stat.MW.astype(float)

for col in cols:
    playing_stat[col] = playing_stat[col] / playing_stat.MW
In [62]:
playing_stat[(playing_stat[['HomeTeam','AwayTeam']]=='Liverpool').any(axis=1)].head()
Out[62]:
Date HomeTeam AwayTeam FTHG FTAG FTR HTGS ATGS HTGC ATGC ... AwayTeamLP HTFormPtsStr ATFormPtsStr HTFormPts ATFormPts HTGD ATGD DiffPts DiffFormPts DiffLP
6 2000-08-19 Liverpool Bradford 1 0 H 0 0 0 0 ... 17.0 MMMMM MMMMM 0 0 0.000000 0.000000 0.000000 0.000000 -13.0
10 2000-08-21 Arsenal Liverpool 2 0 H 0 1 1 0 ... 4.0 LMMMM WMMMM 0 3 -0.500000 0.500000 -1.500000 -1.500000 -2.0
26 2000-08-26 Southampton Liverpool 3 3 D 3 1 4 2 ... 4.0 LDMMM LWMMM 1 3 -0.333333 -0.333333 -0.666667 -0.666667 11.0
38 2000-09-06 Liverpool Aston Villa 3 1 H 4 2 5 4 ... 6.0 DLWMM LDDMM 4 2 -0.250000 -0.500000 0.500000 0.500000 -2.0
43 2000-09-09 Liverpool Man City 3 2 H 7 7 6 9 ... 18.0 WDLWM WLWLM 7 6 0.200000 -0.400000 0.200000 0.200000 -14.0

5 rows × 34 columns

In [63]:
# Simplifies the problem to only 'H' vs 'NH'
playing_stat['FTR'] = playing_stat.FTR.apply(only_hw)
playing_stat[(playing_stat[['HomeTeam','AwayTeam']]=='Liverpool').any(axis=1)].head()
Out[63]:
Date HomeTeam AwayTeam FTHG FTAG FTR HTGS ATGS HTGC ATGC ... AwayTeamLP HTFormPtsStr ATFormPtsStr HTFormPts ATFormPts HTGD ATGD DiffPts DiffFormPts DiffLP
6 2000-08-19 Liverpool Bradford 1 0 H 0 0 0 0 ... 17.0 MMMMM MMMMM 0 0 0.000000 0.000000 0.000000 0.000000 -13.0
10 2000-08-21 Arsenal Liverpool 2 0 H 0 1 1 0 ... 4.0 LMMMM WMMMM 0 3 -0.500000 0.500000 -1.500000 -1.500000 -2.0
26 2000-08-26 Southampton Liverpool 3 3 NH 3 1 4 2 ... 4.0 LDMMM LWMMM 1 3 -0.333333 -0.333333 -0.666667 -0.666667 11.0
38 2000-09-06 Liverpool Aston Villa 3 1 H 4 2 5 4 ... 6.0 DLWMM LDDMM 4 2 -0.250000 -0.500000 0.500000 0.500000 -2.0
43 2000-09-09 Liverpool Man City 3 2 H 7 7 6 9 ... 18.0 WDLWM WLWLM 7 6 0.200000 -0.400000 0.200000 0.200000 -14.0

5 rows × 34 columns

Then do the same for the remaining seasons (from 2000-2001 until 2015-2016)

Feature engineering is done repeatedly to improve a model's performance

3. Exploratory data analysis

Making sense of the data

In [64]:
import matplotlib.pyplot as plt
%matplotlib inline
In [65]:
playing_stat.columns
Out[65]:
Index(['Date', 'HomeTeam', 'AwayTeam', 'FTHG', 'FTAG', 'FTR', 'HTGS', 'ATGS',
       'HTGC', 'ATGC', 'HTP', 'ATP', 'HM1', 'AM1', 'HM2', 'AM2', 'HM3', 'AM3',
       'HM4', 'AM4', 'HM5', 'AM5', 'MW', 'HomeTeamLP', 'AwayTeamLP',
       'HTFormPtsStr', 'ATFormPtsStr', 'HTFormPts', 'ATFormPts', 'HTGD',
       'ATGD', 'DiffPts', 'DiffFormPts', 'DiffLP'],
      dtype='object')
In [66]:
# Read data and drop redundant column.
usecols = ['Date', 'MW', 'HomeTeam', 'AwayTeam', 'FTHG', 'FTAG', 'FTR', 'HTP', 'ATP',
           'HM1', 'HM2', 'HM3', 'AM1', 'AM2', 'AM3',
           'HTGD', 'ATGD', 'DiffPts', 'DiffFormPts', 'DiffLP']
data = pd.read_csv(dataset_loc + 'final_dataset.csv', usecols=usecols)

data.sample(10)
Out[66]:
Date HomeTeam AwayTeam FTHG FTAG FTR HTP ATP HM1 HM2 HM3 AM1 AM2 AM3 MW HTGD ATGD DiffPts DiffFormPts DiffLP
5874 2015-12-26 Man City Sunderland 4 1 H 1.777778 0.666667 L W L L L L 18.0 0.777778 -0.833333 1.111111 0.000000 -14.0
3926 2010-11-13 Wigan West Brom 1 0 H 0.846154 1.230769 D L L D L L 13.0 -0.923077 -0.384615 -0.384615 -0.153846 -2.0
5552 2015-02-07 Leicester Crystal Palace 0 1 NH 0.708333 0.958333 L L W L W W 24.0 -0.666667 -0.375000 -0.250000 -0.041667 7.0
599 2002-01-19 Leicester Newcastle 0 0 NH 0.727273 1.772727 L D L L L W 22.0 -1.045455 0.500000 -1.045455 -0.272727 2.0
3626 2010-01-17 Aston Villa West Ham 0 0 NH 1.666667 0.857143 L L W L W D 21.0 0.523810 -0.428571 0.809524 0.238095 -3.0
4355 2011-12-26 West Brom Man City 0 0 NH 1.166667 2.444444 W W L W W L 18.0 -0.388889 2.111111 -1.277778 -0.166667 8.0
3653 2010-02-06 Burnley West Ham 2 1 H 0.833333 0.875000 L L L D D D 24.0 -0.958333 -0.375000 -0.041667 -0.208333 9.0
3763 2010-04-17 Tottenham Chelsea 2 1 H 1.828571 2.200000 W W L W W W 35.0 0.800000 1.571429 -0.371429 -0.028571 5.0
3930 2010-11-20 Arsenal Tottenham 2 3 NH 1.857143 1.357143 W W L W D L 14.0 1.000000 0.071429 0.500000 0.500000 -1.0
1363 2004-01-31 Leicester Aston Villa 0 5 NH 0.869565 1.173913 D L D L L W 23.0 -0.304348 -0.260870 -0.304348 -0.130435 2.0
In [67]:
# Remove first 3 matchweeks
data = data[data.MW > 3]

columns_to_drop = ['Date', 'HomeTeam', 'AwayTeam', 'FTHG', 'FTAG', 'MW', 'DiffPts']
data.drop(columns=columns_to_drop, inplace=True)

data.sample(10)
Out[67]:
FTR HTP ATP HM1 HM2 HM3 AM1 AM2 AM3 HTGD ATGD DiffFormPts DiffLP
3216 H 0.666667 1.000000 L D L L D L -1.111111 0.277778 -0.222222 9.0
3105 NH 1.285714 2.000000 L W L W D W 1.000000 0.714286 -0.285714 5.0
5959 NH 1.807692 1.846154 L W D W W W 0.807692 1.000000 -0.153846 -3.0
5460 NH 0.800000 0.866667 D L L L L L -0.400000 -0.400000 -0.133333 -1.0
4801 NH 1.640000 0.800000 W D D L D L 0.400000 -1.040000 0.240000 -9.0
5004 H 1.428571 1.714286 L W D W W W 1.000000 0.428571 -0.571429 -4.0
1707 NH 0.789474 1.315789 L W L W W W -0.789474 0.157895 -0.263158 3.0
4278 NH 1.200000 1.900000 L W L W D W -0.400000 0.600000 -0.700000 1.0
2275 H 1.184211 1.184211 L W W D D L -0.289474 -0.236842 0.105263 6.0
3950 H 1.812500 0.937500 W L W D L D 0.937500 -0.187500 0.375000 -9.0
In [68]:
# Total number of matches
n_matches = data.shape[0]

# Calculate number of features.
n_features = data.shape[1] - 1

# Calculate matches won by home team.
n_homewins = len(data[data.FTR == 'H'])

# Calculate win rate for home team.
win_rate = (float(n_homewins) / (n_matches)) * 100

# Print the results
print("Total number of matches: {}".format(n_matches))
print("Number of features: {}".format(n_features))
print("Number of matches won by home team: {}".format(n_homewins))
print("Home team win rate: {:.2f}%".format(win_rate))
print("Home team not win rate: {:.2f}%".format(100-win_rate))

# Visualising basic info
data.groupby('FTR').count()['HTP'].plot.bar(figsize=(8,4), fontsize=16, alpha=0.5)
plt.xlabel('Full time result', fontsize=16)
plt.show()
Total number of matches: 5600
Number of features: 12
Number of matches won by home team: 2603
Home team win rate: 46.48%
Home team not win rate: 53.52%
In [69]:
# Available columns to explore
data.columns
Out[69]:
Index(['FTR', 'HTP', 'ATP', 'HM1', 'HM2', 'HM3', 'AM1', 'AM2', 'AM3', 'HTGD',
       'ATGD', 'DiffFormPts', 'DiffLP'],
      dtype='object')
In [71]:
# Check some histogram
col = 'HTGD'
col = 'DiffFormPts'
bins = 100
data[data.FTR=='H'][col].hist(bins=bins, alpha=0.5, figsize=(10,6), label='Home won')
data[data.FTR=='NH'][col].hist(bins=bins, alpha=0.5, label='Home not won')
plt.title(col + ' histogram', fontsize=18)
plt.legend()
plt.show()
In [72]:
# Visualising distribution of data
from pandas.plotting import scatter_matrix

# col_list = ['HTGD','ATGD','HTP','ATP','DiffFormPts','DiffLP']
col_list = ['HTGD','HTP','DiffFormPts']

scatter_matrix(data[col_list], diagonal='hist',
               hist_kwds={'bins':20, 'edgecolor':'white', 'color':'green', 'alpha':0.3}, figsize=(10,10))
plt.show()

Spending time on exploratory data analysis is important to gain insights

4. Model building

What kind of prediction? Regression vs Classification?

In [73]:
data.head()
Out[73]:
FTR HTP ATP HM1 HM2 HM3 AM1 AM2 AM3 HTGD ATGD DiffFormPts DiffLP
30 H 1.25 1.00 D D W D W L 0.50 0.25 0.25 -16.0
31 NH 0.75 0.25 L L W D L L -0.50 -0.75 0.50 -2.0
32 H 1.00 1.00 L D W D W L 0.00 0.25 0.00 -3.0
33 NH 0.75 0.50 L L W D L D -0.25 -0.25 0.25 3.0
34 NH 1.00 1.50 D L W W W L 0.00 0.75 -0.50 3.0
In [74]:
# Separate into feature set and target variable
X_all = data.drop(['FTR'],1)
y_all = data['FTR']

Label = what to predict

1 if Home team won, else 0

In [75]:
y_all = y_all.apply(lambda x: 1 if x=='H' else 0)
y_all.head()
Out[75]:
30    1
31    0
32    1
33    0
34    0
Name: FTR, dtype: int64

Features = 'independent' varibles = regressors

In [76]:
X_all.head()
Out[76]:
HTP ATP HM1 HM2 HM3 AM1 AM2 AM3 HTGD ATGD DiffFormPts DiffLP
30 1.25 1.00 D D W D W L 0.50 0.25 0.25 -16.0
31 0.75 0.25 L L W D L L -0.50 -0.75 0.50 -2.0
32 1.00 1.00 L D W D W L 0.00 0.25 0.00 -3.0
33 0.75 0.50 L L W D L D -0.25 -0.25 0.25 3.0
34 1.00 1.50 D L W W W L 0.00 0.75 -0.50 3.0
In [77]:
# one-hot encoding
X_all = pd.get_dummies(X_all, columns=['HM1', 'HM2', 'HM3', 'AM1', 'AM2', 'AM3'])
In [78]:
X_all.head()
Out[78]:
HTP ATP HTGD ATGD DiffFormPts DiffLP HM1_D HM1_L HM1_W HM2_D ... HM3_W AM1_D AM1_L AM1_W AM2_D AM2_L AM2_W AM3_D AM3_L AM3_W
30 1.25 1.00 0.50 0.25 0.25 -16.0 1 0 0 1 ... 1 1 0 0 0 0 1 0 1 0
31 0.75 0.25 -0.50 -0.75 0.50 -2.0 0 1 0 0 ... 1 1 0 0 0 1 0 0 1 0
32 1.00 1.00 0.00 0.25 0.00 -3.0 0 1 0 1 ... 1 1 0 0 0 0 1 0 1 0
33 0.75 0.50 -0.25 -0.25 0.25 3.0 0 1 0 0 ... 1 1 0 0 0 1 0 1 0 0
34 1.00 1.50 0.00 0.75 -0.50 3.0 1 0 0 0 ... 1 0 0 1 0 0 1 0 1 0

5 rows × 24 columns

Split data for train and test

Why?

In [79]:
from sklearn.model_selection import train_test_split

# Shuffle and split the dataset into training and testing set.
X_train, X_test, y_train, y_test = train_test_split(X_all, y_all, test_size = 0.3, stratify = y_all)
In [80]:
from sklearn.linear_model import LogisticRegression
# from sklearn.ensemble import RandomForestClassifier
# from sklearn.svm import SVC

Logistic regression

In [81]:
logReg = LogisticRegression()
logReg.fit(X_train, y_train)

y_train_pred = logReg.predict(X_train)
y_test_pred = logReg.predict(X_test)
In [82]:
from sklearn.metrics import confusion_matrix
from sklearn.metrics import classification_report
import seaborn as sns
In [83]:
print("Home team win rate: {:.2f}%".format(win_rate))
print("Home team not win rate: {:.2f}%".format(100-win_rate))

print('================ TRAIN SCORE ================')
confusion_train = pd.DataFrame(confusion_matrix(y_train, y_train_pred))

print(classification_report(y_train, y_train_pred))
plt.figure(figsize = (5,5))
sns.heatmap(confusion_train, annot=True, cmap=plt.cm.Blues, cbar=False, fmt='d')
plt.ylabel('true label', fontsize=18)
plt.xlabel('prediction', fontsize=18)
plt.show()

print('================ TEST SCORE ================')
confusion_test = pd.DataFrame(confusion_matrix(y_test, y_test_pred))

print(classification_report(y_test, y_test_pred))
plt.figure(figsize = (5,5))
sns.heatmap(confusion_test, annot=True, cmap=plt.cm.Blues, cbar=False, fmt='d')
plt.ylabel('true label', fontsize=18)
plt.xlabel('prediction', fontsize=18)
plt.show()
Home team win rate: 46.48%
Home team not win rate: 53.52%
================ TRAIN SCORE ================
             precision    recall  f1-score   support

          0       0.67      0.73      0.70      2098
          1       0.65      0.59      0.62      1822

avg / total       0.66      0.67      0.66      3920

================ TEST SCORE ================
             precision    recall  f1-score   support

          0       0.66      0.74      0.69       899
          1       0.65      0.56      0.60       781

avg / total       0.65      0.65      0.65      1680

Ready to bet?

In [84]:
predictions = pd.DataFrame(np.column_stack([y_test.values, y_test_pred]), columns=['Actual', 'Prediction'], index=y_test.index)
predictions.head(10)
Out[84]:
Actual Prediction
2584 0 0
3133 1 1
140 0 0
1279 0 0
1284 1 1
5437 1 0
4745 0 0
899 1 1
44 1 1
302 0 0

Map the predictions back

In [85]:
# Check back
usecols = ['Date', 'MW', 'HomeTeam', 'AwayTeam']
data = pd.read_csv(dataset_loc + 'final_dataset.csv', usecols=usecols)

mapped_predictions = data.join(predictions, how='right')
mapped_predictions.head(10)
Out[85]:
Date HomeTeam AwayTeam MW Actual Prediction
2584 2007-03-31 Newcastle Man City 31.0 0 0
3133 2008-10-29 Fulham Wigan 10.0 1 1
140 2000-11-25 Coventry Aston Villa 15.0 0 0
1279 2003-11-30 Man City Middlesbrough 14.0 0 0
1284 2003-12-06 Man United Aston Villa 15.0 1 1
5437 2014-11-23 Crystal Palace Liverpool 12.0 1 0
4745 2012-12-26 Reading Swansea 19.0 0 0
899 2002-11-23 Aston Villa West Ham 14.0 1 1
44 2000-09-09 Man United Sunderland 5.0 1 1
302 2001-03-31 Sunderland Leeds 31.0 0 0